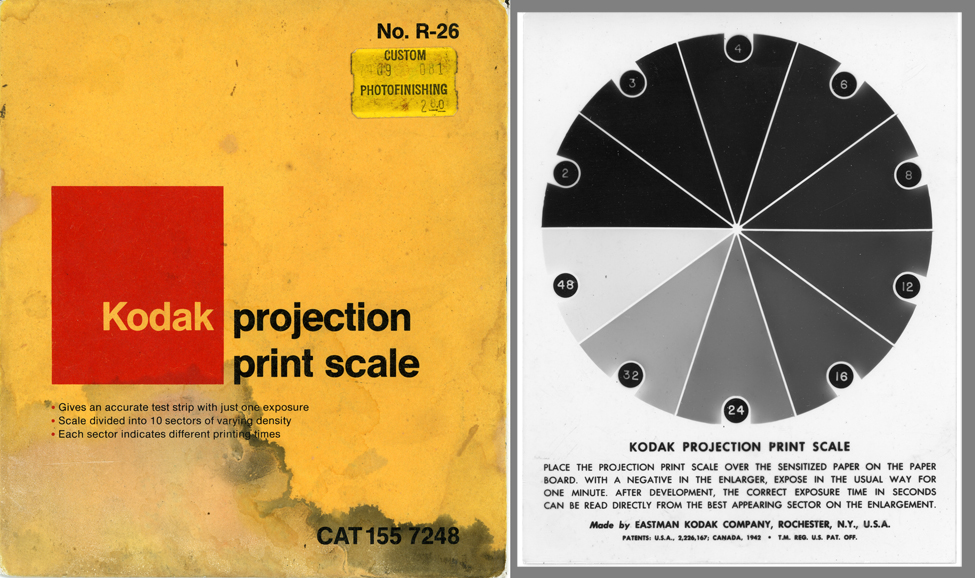
For this incarnation, each pie wedge was measured with an X-Rite Model 331 Densitometer, and also measured by a BPW-34 Silicon Detector connected to a Newport Model 820 Power Meter instead its 1 cm2 detector to measure how much laser light is passing through each wedge to calibrate the exposure dose. The exposure time was chosen so that approximately 100 µJ/cm2 could be obtained with one of the median wedges, like step 8. Here is this calibration, using 40" as the exposure time for the film sitting on top of the device:
Step |
Exposure |
Step |
Exposure |
2 |
23 |
12 |
133 |
3 |
40 |
16 |
208 |
4 |
45 |
24 |
283 |
6 |
83 |
32 |
400 |
8 |
92 |
48 |
600 |
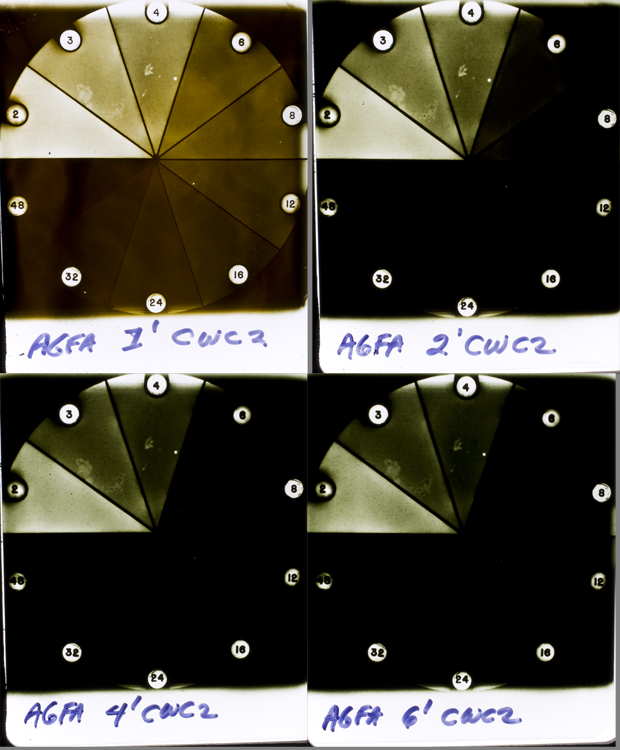
Here is an example of a family of exposed wedges, developed for a variety of times:
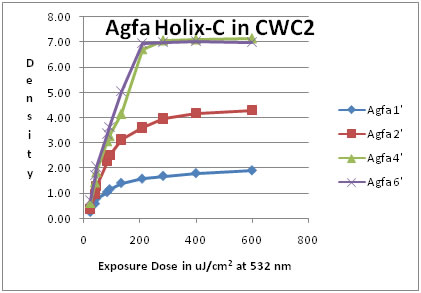
Here is the density data gleaned from the above:
Step |
Exposure |
Agfa 1' |
Agfa 2' |
Agfa 4' |
Agfa 6' |
2 |
23 |
0.25 |
0.38 |
0.63 |
0.75 |
3 |
40 |
0.58 |
0.96 |
1.45 |
1.72 |
4 |
45 |
0.79 |
1.27 |
1.85 |
2.07 |
6 |
83 |
1.04 |
2.26 |
3.08 |
3.38 |
8 |
92 |
1.15 |
2.50 |
3.28 |
3.64 |
12 |
133 |
1.40 |
3.12 |
4.16 |
5.05 |
16 |
208 |
1.57 |
3.60 |
6.72 |
6.95 |
24 |
283 |
1.68 |
3.95 |
7.07 |
7.00 |
32 |
400 |
1.79 |
4.18 |
7.11 |
7.03 |
48 |
600 |
1.90 |
4.28 |
7.15 |
6.99 |
And here is that data in graphical format:
More detailed analysis forthcoming in a link yet to be written.